How Transparent are Your Back-Office Operations?

Because of operational silos, disparate systems, complex work, multiple locations, and remote workers, many back-office lack the operational visibility and data they need to answer this very basic question.
In fact, in a 2018 survey of back-office managers and directors, only 20% said they had an automated operational dashboard of team/organizational performance, and only 12% had automated performance scorecards for individual employees.1
Creating a Holistic Picture
There are digital solutions that can capture employee activity data directly from the desktop; but even this data source only presents part of the picture. Employees can spend time on work-related activities that don’t involve their desktop. They could be opening mail and scanning documents.
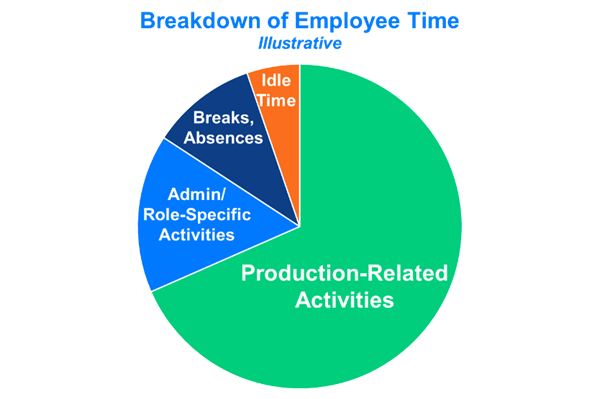
In some back offices they could be making or responding to phone calls. They also have other valid activities that account for their time, such as meetings, training, breaks, lunches, etc.
So how do you get a complete picture?
Back-offices need another means of tracking time spent in these off-system activities. Often this is accomplished with manual tick sheets or electronic logs. The challenge this presents is that, to get a full picture of how time is spent, the manager is responsible for manually compiling the data for each employee and collectively for the team.
This activity can consume so much of managers’ time that they feel more like glorified reporting analysts than managers.
Comparing Actuals to Goals
The next question back-office managers ask is:
“Is this the right level of activity and can we increase time spent on production-related activities?”
So how do you transform the “as is” activity data into insights that can change employee behaviors?
One way is to analyze the data to establish goals for time spent in the various activities. By automating the collection of both desktop activity and off-system activity—and transforming that data into meaningful metrics that appear on individual performance scorecards—both employees and managers can see current, actual performance against their goal, and potentially their peers in a similar role.
Having this real-time data helps employees self-correct behaviors to focus on the higher value production-related activities.
The data can become a manager’s “virtual” walk-around. Instead of, as in the old days, walking the floor to see who is doing what, managers can now view their team scorecard which reflects both system and non-system activities for onsite and remote employees.
This real-time data helps them focus their team members on achieving their productivity goals.
Identifying What Could Be
Once managers have visibility and can measure how time is spent, they then typically ask:
“How much more could my people be doing?”
With Operations Visualizer, back-office managers now have the data they need to:
- Identify employees who are struggling and need coaching
- Compare employees to identify the best practices of top performers and share those with the rest of the team
- Identify where there are opportunities to:
- Reduce waste
- Improve productivity
- Find hidden or untapped capacity.
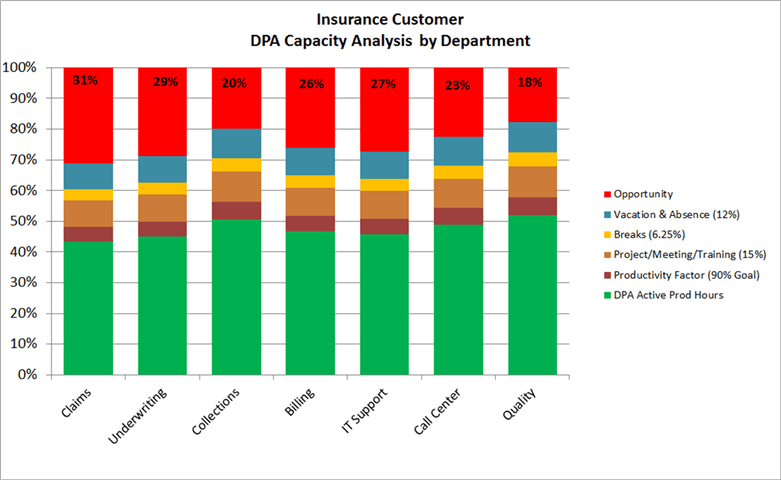
As shown below, a leading multi-line insurer deployed Operations Visualizer across multiple departments and found an average of 25 percent in untapped capacity.
Untapped capacity is not the only insight Operations Visualizer can unearth.
Read about the numerous discoveries a global insurer made with Operations Visualizer: “How to Equitably Manage Employee Productivity Across Teams, Sites and WFH Staff.”
Want to learn even more? Watch the Verint Virtual presentation, Operations Visualizer: Creating & Sustaining Back Office Operational Excellence, or let us know your interest by clicking .
1 2018 Survey Results: The State of the Back Office, Verint Systems