DB Vertrieb GmbH Uses Verint to Increase the User-Friendliness of Its Website and Improve Issue Detection

The Challenge
DB Vertrieb GmbH is responsible for the distribution and sale of tickets for passenger services for Deutsche Bahn and many other travel providers. It acts as the interface between Deutsche Bahn and around five-and-a-half million passengers in Germany every day. It manages various sales channels, from the website bahn.de and the app DB Navigator, to the travel centers and vending machines, to sales partners and business customers. With more than 50 million visitors each month, the bahn.de website is the first port of call for many travelers to get information about timetables or fares and to book their trip. The site is optimized on a continuous basis, with A/B testing carried out to check how changes are received by users. Since the results from A/B testing only offer quantitative conclusions, DB Vertrieb was looking for an additional solution to provide more qualitative interpretations. It required a solution that helps to understand the behavior of its users on the website through continuous monitoring and enables A/B testing as a supplementary measure. In this way, problems or technical issues should be detected quickly and optimized in a user-friendly manner.
The Solution
DB Vertrieb chose Verint’s Digital Behavior Analytics tool to utilize scroll, click and conversion maps, form analysis and session replays to obtain anonymous information about how customers interact with a website. After setting up the cloud solution, the conversion team at DB Vertrieb was introduced to the software in a two-day seminar, where they then carried out their first independent analyses.
The team then later carried out further analysis, including of the bahn.de homepage, where they tested whether pre-filling the origin and destination station fields increased the conversion rate. The underlying hypothesis was that by pre-filling the two fields with previous entries, customers would need less time to start searching for a journey.
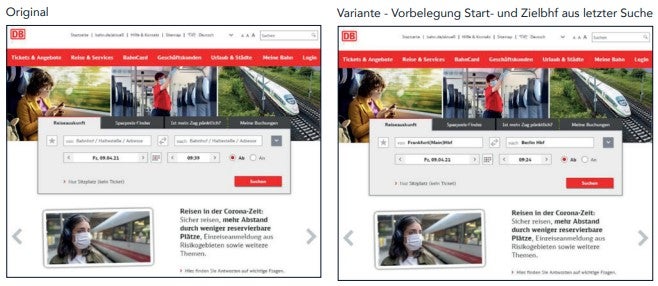
Fig.
Comparison of the two variants (without clicks)
Click maps were used to visualize the results of a two-week testing period for two page variants. The results showed how often customers interacted with each field in the form, among other insights.
Results
- Increase in search queries for journey options by three percentage points, which corresponds to an approx. 54,000 additional requests per month.
- Reduced interaction time with the input screen for journey searches by two seconds.
- Detailed information about user behavior.
- Implementation of a closed optimization cycle.
The Result
The test confirmed the team’s hypothesis. By pre-filling the input fields, the interactions with these fields were halved, meaning about half of the users searched using the default values.
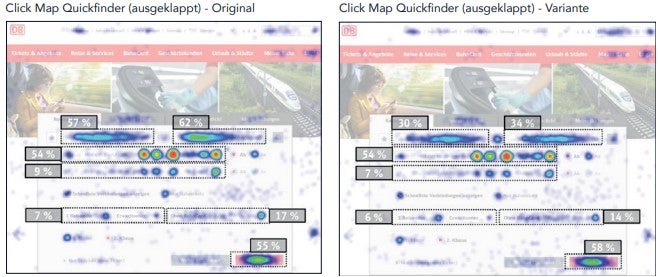
Fig.
Comparison of click maps
With this improvement, DB Vertrieb was able to make the website more convenient for its users. At the same time, 3 percent more visitors completed their search for a journey if the fields were pre-filled. With around 18 million unique visitors on the home page per month, this represents an increase of around 54,000 journey queries.
However, the conversion team only reached these conclusions through detailed analyses that provided them with information about the causes of customer behavior. For example, in some places, users need a specific piece of information to complete a booking. If this information is not provided within the user’s journey through the site, some of them will cancel the operation.
This is a carousel with slides that do not auto-rotate. Use the Next and Previous buttons to navigate.
Of course, not every query leads to a booking. Customers often look for information in advance and buy the ticket at a later visit to the site, once they know more details about the trip, have booked a hotel or have spoken to the rest of their party. Some customers also use the search function to find out about possible delays or cancelations, for example in the event of a storm.
Dimitri Penner is a Conversion Optimizer at DB Vertrieb GmbH and now combines many A/B tests with an analysis by Verint Digital Behavior Analytics. “The results show how customers deal with new elements or the effect of error messages. This is very valuable, because even with lots of experience it is impossible to foresee everything. Customers are always interacting with the site in ways that I would never have expected,” he says.
The results of the analyses are regularly discussed with the product management team for the website and are used in workshops to form new hypotheses for the continuous improvement of the site. The new variants are first tested in a laboratory environment, then programmed and finally checked using A/B testing and Digital Behavior Analytics. The variant that performs best is then recommended for regular use. This creates a closed optimization cycle.
Schedule a Demo of Verint Digital Behavior Analytics Today
†If we know of you from our business directory we will prepopulate the form for you.
This site is protected by reCAPTCHA and the Google Privacy Policy and Terms of Service apply.
Thank You
Thank you for your request. A Verint team member will follow up with you soon.
